What is Galapagos and how can it be used to inform design decisions.
It’s been several years now since the Galapagos component was included in Grasshopper for Rhino. Back in 2011 Charles Aweida wrote a blog post that included a proof of concept in which he used this tool to optimize a simple multi-sided form to receive the lowest amount of heat energy from the sun. Since then, we’ve been trying to create optimization tools at the building scale that can inform our decision making process during design. The videos below are optimizations for heat gain and views on a site in Boston, MA. We are actively looking for ways to expand this list to include a wider range of project / site specific design drivers such as daylighting, structure, and wind.
What is Galapagos?
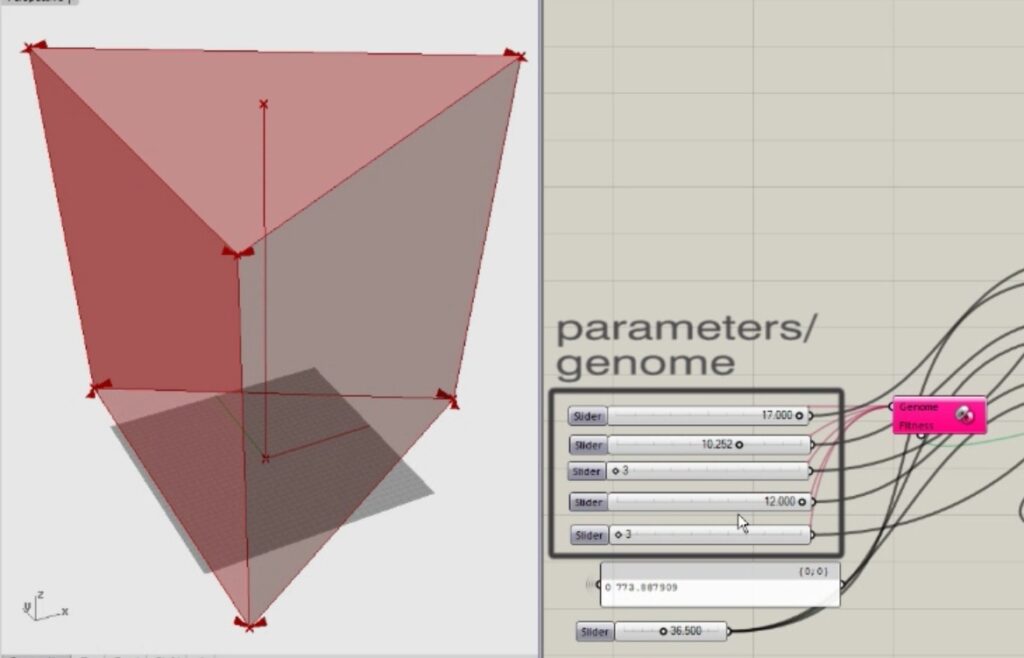
Galapagos is a component inside of grasshopper that can optimize a shape so that it best achieves a user defined goal. For this to work, Galapagos needs a series of options or genes to try out, and a defined goal or fitness value. In the POC video mentioned above, there are 5 genes that are used to generate an object.

These are 5 numerical values within a given range that Galapagos can try in various combinations. Each combination, or genome, produces a unique object. The goal or fitness is defined as the lowest value of total solar radiation measured on the object’s surface.
Galapagos is faster than a brute force optimization algorithm because it does not try every possible variable combination in order to arrive at the optimum solution. It can do this accurately in much less time by “learning” from each successive round of experiments or generations and progressively closing in on the best answer. In practice this means the difference between a week long calculation and one that can be completed overnight. Up until now, all of our optimizations use Galapagos as the solver, however there are plenty of other tools out there. Goat and Octopus are two others that are available as components inside the Grasshopper environment.
In Practice
Using Galapagos to solve simple scenarios with only a few variables is unlikely to produce a surprising result. Things get more interesting when we look at specific multi-variable problems that are not easy to visualize or solve quickly. For example, when relevant building configurations are tested on a specific site while considering nearby buildings and specific weather data. The key to getting good results lies in how the problem is formulated. The adage, “Garbage in = garbage out” applies to the way we set things up in Grasshopper. There is an art to getting good results and it comes down to understanding how Galapagos works.
There are essentially two parts to setting up a Galapagos simulation: the gene pool and the fitness. The genes are the numerical values that Galapagos will test. Each unique combination of these variables (called the genome) will produce a design option that Galapagos will measure. The fitness is the measurement by which Galapagos will rank each configuration.
In the example below, 4 variables (genes) are used to generate a four sided building volume of constant area. Each of these options is tested for incident solar radiation with an environmental analysis tool – in this case we used DIVA. DIVA calculates the total cumulative solar radiation and sends this value to Galapagos, which uses it as the fitness to rank each configuration.
The graph at the top of the editor shows the optimization as it progresses through multiple generations. Optimal configurations are marked as the results are improved. The two charts on the lower right and middle of the Galapagos editor show convergence of the genes towards optimal configurations. The graphic on the lower right is a representation of each genome (or unique combination of 4 genes) tested where each gene is represented as a green band.
Conclusion – Turning Data into Knowledge
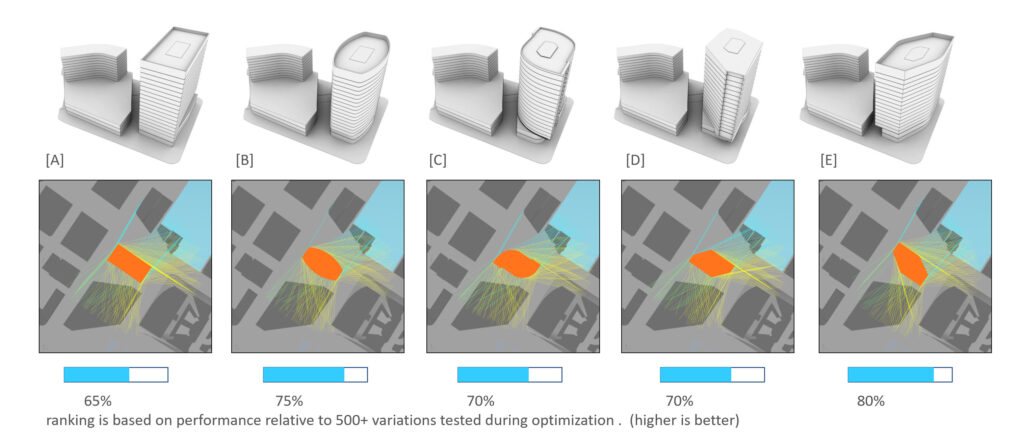
So generating heaps of relevant data has become very easy, but what can we do with it? Sorting the information and observing trends and patterns is a topic for another post, but it’s worth pointing out that this becomes possible with iterative tools like Galapagos. For a more concrete example of how Galapagos data can be used to improve a typical analysis, let’s go back to the view optimization video at the top the page. Below we see five options for a tower design. Normally, if we were to compare them we would run an analysis on each option and rank them from worst to best. We would probably include some metrics to give us some idea of relative scale. From this, we could make statements like, “The views from option D are better than C but only by a little bit”. The problem with this is that the scale is only relative to the 5 options tested. What we really want to know is how these options compare to the very best version if the only thing we cared about was this single factor (in this case, the quality of the view). The scale at the bottom gives us a sense of how these options rank within the realm of what is achievable on site. Understanding performance within the context of the full problem space can influences our design thinking in a way that’s quite different than a ranking which only affirms our biases.
